by Ella Henry
The Great Schools Partnership was honored to have Ella Henry intern with us during the summer of 2024 in advance of her senior year at Bowdoin College as part of their Cultivated Internship program. Ella split her time at GSP largely focusing on two areas of our work – coaching support and research and evaluation. In addition to culling, synthesizing, and cataloging resources to support GSP coaches in the field, she also took on multiple evaluation projects, like the one described here. In these projects, Ella used data in the name of storytelling for individual schools and districts seeking to raise marginalized voices, challenge the imbalance of power and privilege, and ensure just outcomes for each student.
Last June, I supported a school in Vermont in coding all of the qualitative feedback they received from constituents on their Portrait of a Graduate draft. In more amicable terms, I went through every statement from each community forum, and, one by one, identified important themes, ranking them by frequency. In all candor, qualitative coding analysis is widely known for being monotonous, and I was less than eager to get started. Little did I know I would be sorely mistaken.
I spent the morning flipping through chart paper covered in comments, questions, and criticisms from the community. I was less than halfway through when I read a staff member’s observation that stuck with me. It stood out to me for multiple reasons: one, that there were blotches of ink on the paper at the force the poor marker was wielded with, and two, that it was significantly longer than other contributions. It ranted about the ‘blundstone kids’ versus the ‘farm kids’, blaming the school system and society as a whole for disrespecting the humanity of one another. As I deconstructed it to find the proper codes, all I could picture was a tense room full of red-faced adults raising their voices at one another.
Despite my seven spreadsheets of codes—each made up of more than one sheet—I walked away from the office that day thinking, “Wow, that school is really divided. They are really falling apart.” Spoiler alert! This was not the case.
I revisited the project the following day, expecting the statements I coded as ‘division’ to exceed all the other codes by a landslide, only to find that three others ranked significantly higher. So many ideas and arguments had rained down on me that it muddied the conversation’s true overarching themes. That staff member’s comment had made a lasting impression on me, and gaining sight of the bigger picture mended my inaccurate perception and enlightened me. This school was not suffering from a fragmented community rife with discord, but rather lacked the means for communal gatherings—two completely different things with completely different antidotes.
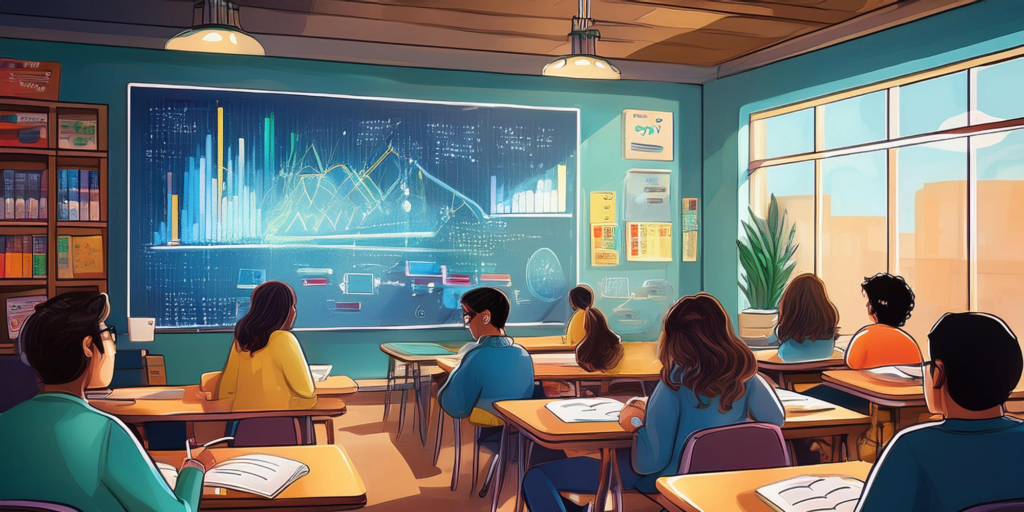
In times of struggle, we tend to listen to negative voices with a more open ear, even if they shout from a sea of positive ones. In doing so, we fail to see the overall view, and more importantly, we fail to consider other voices. Analyzing qualitative data can shine a light on those who are not heard as clearly. It can build a lifeboat in an information frenzy.
Data has the ability to tell illuminating stories about a community. It can take on a voice of its own, speaking for the collective and driving a more equitable educational landscape.